

Contact Us | 1.800.2.BERLIN
Consumer Megatrends and Packaing – Is Your Packaging Missing the Boat?
U.S. consumers spent over $10 trillion in 2012. This spending was made across billions of individual transactions and influenced by a wide array of dynamics. How well any company or product does in the market is based on how successfully it understands and embraces (and even helps form) these dynamics. Research into what consumers need and want is useful to improve the odds of winning more transactions and garnering a greater share of wallet. In 2011, we published a white paper, Consumer Megatrends and Packaging Implications: How Companies Can Ride Consumers’ Coattails, which identified consumer motivations and how values, behaviors, and attitudes translated into overarching consumer trends. That paper was a qualitative review of literature and prior research, and it presented a set of trends and broad packaging implications. This paper takes the research one step further and works to quantitatively assess, through a broad-based survey of packaging professionals, the lifestage of each trend (whether it is on the rise or in decline), the adoption rate of each trend (whether companies are reacting to the trend), and the packaging tactics being used. We will begin by reviewing the methodology and approach, and then we will present an analysis of the data and share the implications for packaging. Before we get into the new research, we will first turn to a case study of why an appreciation of consumer trends matters.
Case Study: The Power of Consumer Trends
When consumer desire and consumer momentum intersect with the right ideas, offering, and marketing, exciting things can happen.
Chobani exploiting consumers’ desire to be healthier
Chobani started operating in 2007, and now it’s a leading yogurt brand in the U.S. with sales over $1 billion. It wasn’t the first Greek yogurt in the U.S. market (that was Fage), but Chobani was smart in their marketing and timing, and they leveraged the “personal health and wellness” megatrend to its fullest. Chobani became synonymous with Greek yogurt, and even the mainstream yogurt kings were left scrambling. Yoplait and Danone were both slow to enter and have lagged in this segment ever since. Even Fage, the segment’s first-mover, has stumbled and commands only a fraction of Chobani’s market share.
Whole Foods cashing in on the sustainability movement
Often considered to be the most socially responsible business in the U.S., Whole Foods has ridden the “community and sustainability” wave for years. It is one of the most profitable grocery chains in the industry because it struck a chord in consumer consciousness. Whole Foods leveraged the consumer’s desire to eat healthier and avoid foods that contain unnatural ingredients. Whole Foods shoppers want to be sure that food is being produced in an ethical way, including safe work conditions for workers and humane treatment of animals. It’s not just about buying organic foods; it’s also about fulfilling the shopper’s desire to support a sustainable farm-to-table process. Whole Foods delivers on this need.
Starbucks firing on all cylinders
Thirty years ago, you’d get a cup of coffee at a restaurant for $1. Now people line up at Starbucks to spend over $5 for a latte. Just when more consumers were looking for ways to indulge and experiment in their lives, Starbucks was ready with bold flavors and rich experiences. Starbucks continues to fulfill consumers’ needs by providing lush furniture to relax in along with inviting music. Starbucks also taps into several other consumer megatrends, like the ability to splurge on small pleasures. Starbucks has become a retail juggernaut, while charging high prices, due to the value that consumers get from the total experience.
Fad or trend?
Companies need to be wary of riding a fad or mistiming a megatrend. There are many instances of trends that fizzle out – the “low-carb” fad, for example. And timing needs to be right. Apple introduced the first personal digital assistant in 1993 (the Newton), and it had many of the features that smartphones have today. But Newton failed because there wasn’t enough consumer momentum to sustain it; the product showed up too early. Being late to the game can also be costly; HP tried to enter the tablet arena with its TouchPad device but ended up retreating since most tablet users had already aligned with Apple.
Life would be easy if companies had crystal balls to know which trends had staying power and when to strike for perfect timing. Instead, we’re left to research consumer behavior and draw conclusions about where we think shoppers are heading.

Methodology & Approach
Berlin Packaging surveyed thousands of packaging professionals in December, 2012. The survey was conducted using a web-based research tool.
Response Pool
We received 1,097 survey responses. Respondents cut across many different industries (Table 1) and many different roles (Table 2).
Table 1: Respondent mix by industry
|
Industry
|
% of Respondents
|
| Food and beverage |
20%
|
| Personal care and cosmetics |
15%
|
| Pharmaceutical and nutraceutical |
15%
|
| Industrial chemicals |
11%
|
| Household, auto, and lawn care |
10%
|
| Laboratories, research, and education |
10%
|
| Services |
5%
|
| Other |
14%
|
Table 2: Respondent mix by role
|
Role
|
% of Respondents
|
| Procurement |
25%
|
| Executive Management |
23%
|
| Operations/Quality |
18%
|
| Product Development and R&D |
9%
|
| Designer/Engineer |
8%
|
| Sales |
7%
|
| Marketing/Branding |
6%
|
| Finance, IT, and HR |
2%
|
| Other |
2%
|

Questionnaire
The survey centered on ten consumer megatrends.
|
Megatrend
|
Description and Dynamics
|
| Rise of Boomers |
Adapting to the needs of the 79 million baby boomers who were born between 1946 and 1964. This group now accounts for 26% of the population.
|
| Rise of Singles |
Adapting to the single-person household. The number of single-person households has doubled over the past 50 years, with 28% of U.S. households now consisting of only one person.
|
| Scrimp |
Looking to economize; being sparing or frugal with one’s resources.
|
| Splurge |
Indulging in a luxury or pleasure; treating oneself.
|
| Comfort |
Feeling a sense of physical or psychological ease; lacking any hardship; being nostalgic.
|
| Convenience |
Increasing ease and accessibility; saving resources (time, energy, effort) and decreasing frustration.
|
| Richer & Bolder Experiences |
Delivering a more intense experience to any or all of the senses.
|
| Individualized Connectivity |
Accommodating individual preferences while still allowing relationships and networks to form.
|
| Personal Health & Wellness |
Seeking a healthy lifestyle.
|
| Community & Sustainability |
Building closer ties with those around you or with the earth in general.
|

Respondents commented on each megatrend in these three ways:
1. Momentum: Placing the megatrend in its lifecycle stage.

2. Adoption: Selecting to what degree the respondent’s company is reacting to the megatrend.

3. Packaging Tactics: Within the megatrends that were being adopted, identifying the packaging tactics being used.
Analysis of Data
Results were analyzed in three steps. The first step independently assessed consumer momentum and company adoption for overall respondent feelings on the existence of trends and activity. The second step looked at the relationship between momentum and adoption responses and built an Intensity Matrix for each trend. The third step distilled these matrices and located the “center of gravity” for each trend; this simplifies how the data are shown and helps with synthesizing implications.
Step 1: Overall Trend Assessment
The vast majority of respondents see each of these trends as having momentum to one degree or another. The table below shows the lifestage in which respondents place each trend.
|
|
% of Respondents
|
||||
|
Megatrend
|
Nonexistent
|
Waning
|
Emerging
|
Thriving
|
Total
|
| Rise of Boomers |
3%
|
20%
|
13%
|
64%
|
100%
|
| Rise of Singles |
10%
|
2%
|
35%
|
53%
|
100%
|
| Scrimp |
6%
|
4%
|
30%
|
60%
|
100%
|
| Splurge |
14%
|
36%
|
17%
|
33%
|
100%
|
| Comfort |
23%
|
17%
|
24%
|
36%
|
100%
|
| Convenience |
6%
|
2%
|
20%
|
72%
|
100%
|
| Richer & Bolder Experiences |
21%
|
7%
|
34%
|
38%
|
100%
|
| Individualized Connectivity |
22%
|
5%
|
36%
|
37%
|
100%
|
| Personal Health & Wellness |
7%
|
2%
|
20%
|
71%
|
100%
|
| Community & Sustainability |
7%
|
4%
|
38%
|
51%
|
100%
|

Few respondents (less than 23% in the peak case) see these trends as Nonexistent. Indeed, more than 50% of respondents classify six of the ten trends as Thriving, and nine trends meet the 50% mark when combining both the Thriving and Emerging buckets. But while the trends are acknowledged by the vast majority of respondents, many companies still are not reacting; this is what we call poor adoption. The table below shows how respondents rate the involvement of companies in each trend.
|
|
% of Respondents
|
|||
|
Megatrend
|
No Involvement
|
Testing
|
Commercialized
|
Total
|
| Rise of Boomers |
45%
|
29%
|
26%
|
100%
|
| Rise of Singles |
62%
|
26%
|
12%
|
100%
|
| Scrimp |
31%
|
40%
|
29%
|
100%
|
| Splurge |
56%
|
25%
|
19%
|
100%
|
| Comfort |
60%
|
22%
|
18%
|
100%
|
| Convenience |
27%
|
38%
|
35%
|
100%
|
| Richer & Bolder Experiences |
54%
|
29%
|
17%
|
100%
|
| Individualized Connectivity |
55%
|
31%
|
14%
|
100%
|
| Personal Health & Wellness |
36%
|
29%
|
35%
|
100%
|
| Community & Sustainability |
29%
|
41%
|
30%
|
100%
|
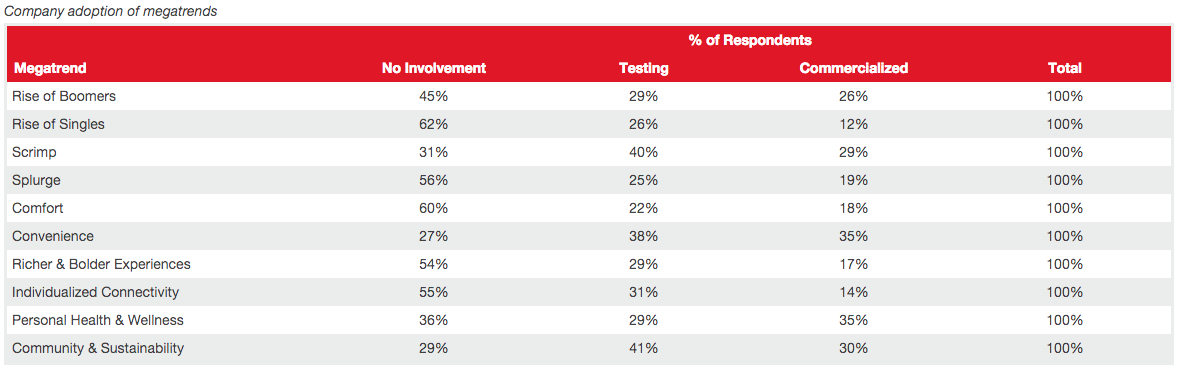
On average across the trends, 46% of respondents report that their company has No Involvement in the trends. And looking at the companies that are involved, fewer than 30% of companies report to have commercialized solutions to eight of the ten trends. This is an important finding, and leaders should discuss – even at this high level – whether they are properly addressing these trends. Additional insight can be gained by looking at a cross-tabulation of the data, as shown in Steps 2 and 3.
Step 2: Intensity Matrix
An Intensity Matrix arrays respondents across two dimensions. The vertical axis shows the degree of momentum that respondents cited for a trend, with high momentum (Thriving) at the top of the table. The horizontal axis shows the degree of adoption companies have with a trend, with high adoption (the company has commercialized items that address that trend) to the right. The matrix template is shown below.
|
|
|
Adoption
|
|
||
|
No Involvement
|
Testing
|
Commercialized
|
Total
|
||
|
Momentum |
Thriving |
|
|
|
|
| Emerging |
|
|
|
|
|
| Waning |
|
|
|
|
|
| Nonexistent |
|
|
|
|
|
|
|
Total |
|
|
|
100%
|
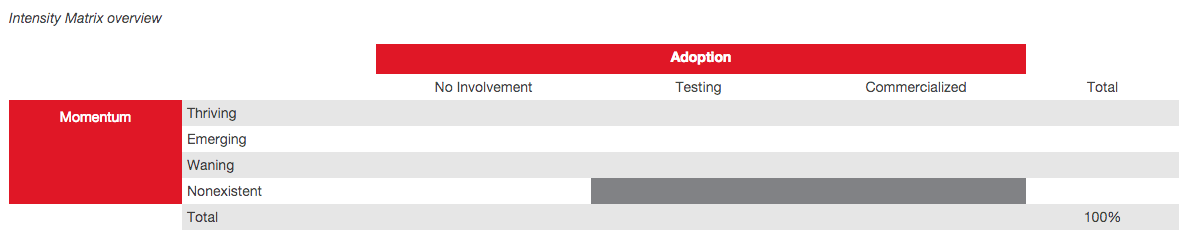
This better explains the data we looked at in Step 1, since we’re now more closely linking a company’s actions with the momentum perceived by that same company. For each trend, every respondent can be placed into this matrix, and then each cell can be looked at as a percentage of all respondents. The greater the percentage in any cell, the greater is the respondent intensity for that cell.
For example, the Intensity Matrix for the Rise of Boomers megatrend is shown below.
|
|
|
Adoption
|
|
||
|
No Involvement
|
Testing
|
Commercialized
|
Total
|
||
| Momentum | Thriving |
24%
|
20%
|
20%
|
64%
|
| Emerging |
6%
|
5%
|
2%
|
13%
|
|
| Waning |
12%
|
4%
|
4%
|
20%
|
|
| Nonexistent |
3%
|
|
|
3%
|
|
|
|
Total |
45%
|
29%
|
26%
|
100%
|

In this matrix, 100% of respondents are represented. In terms of momentum, the far right column shows the vast majority of respondents see this as a trend with healthy momentum; 64% see the trend as Thriving and another 13% see it as Emerging. Yet the bottom row shows only 26% of all respondents have a commercialized product that addresses this trend and only 29% have products in some form of testing. This adds more detail than we saw in Step 1 of the analysis. Further, respondents are cross-tabulated into momentum/adoption cells. The cell with the largest population of respondents is the Thriving/No Involvement cell (with 24% of all respondents). This underscores the fact that many companies are not responding and reacting to trends they admit are real and important.
Step 3: Centers of Gravity
In our analysis, the detailed data of each megatrend’s Intensity Matrix were then distilled into a single point that we call the “center of gravity.” This is where we see the predominant number of respondents in terms of momentum and adoption. This point is plotted onto a chart that shows the same momentum/adoption spectra.
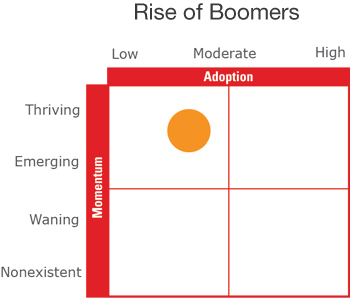
The chart to the right shows the center of gravity for the Rise of Boomers megatrend. It boils the Intensity Matrix down to the predominance of responses being Thriving or Emerging momentum and being Low to Moderate levels of adoption.
This approach necessarily has a lower-resolution of data, but it helps to highlight in a simple way how each trend is perceived by the survey respondents.
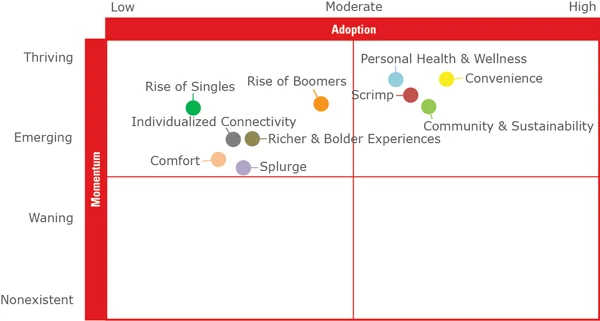
Looking at the center of gravity for all the megatrends highlights the variation in how companies are appreciating and addressing the megatrends.
Centers of gravity by megatrend
Implications
There are two top-level implications from this analysis. The first area addresses the strategic gaps – where consumers’ momentum is strong but companies are not offering solutions. This helps to focus energy in the biggest areas of opportunity. The second implication area looks to the specific packaging tactics being employed. At a minimum, this helps to establish what’s being done today and may spur improvements in those tactics or a look to other approaches.
Strategic Gaps
Given that no megatrend was classified on average as having a Waning or Nonexistent momentum, we zoomed in on the top half of the centers of gravity chart to identify strategic gaps and opportunities. The chart below synthesizes the centers of gravity chart and positions each megatrend into one of five sectors, marked as A through E.
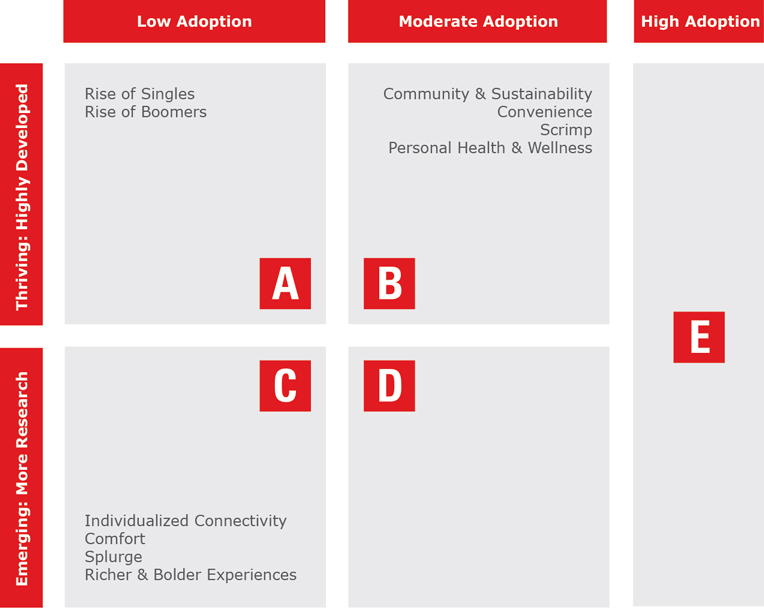
Each sector has a different imperative.
Sector A: ATTACK
These are highly-developed trends with low company involvement (on average). Trends in this sector represent opportunities to invest and jump ahead to meet consumer needs. Start by speaking to consumers to understand their needs and requirements.
Sector B: LEARN
These are highly-developed trends with good company involvement (on average). For companies that are lagging, there are chances to observe and learn from others. For companies that are participating, there are still ways to improve by looking outside your industry or in other geographies to find ways to stand out. Consumer research should be a pillar of work here as well.
Sector C: JOIN
These are emerging trends with low- to mid-adoption (on average). Now is the time to investigate these trends with consumer, competitor, and category research. A word of caution, however; this is where “fads” will show up – trends that fizzle out and never achieve sustainable consumer momentum.
Sector D: WATCH
These trends need to be studied more closely. Some will be emerging and on the upswing, while others may be waning. In this study, no centers of gravity fell into this bucket, although your company may be positioned here depending on how you are embracing certain trends.
Sector E: ADVANCE
This sector is for highly-adopted trends. The implication here is to anticipate the future evolution of consumer needs. In addition, you can experiment and look for new ways to enhance the tactics being used to build even greater acceptance among consumers. No trend in this study achieved near-universal levels of adoption, but certain companies may operate in this space.
Consider each of the megatrends and place your own company on this chart. Even at this high level, you may find things you should rethink about your innovation, marketing, and go-to-market strategies.
Packaging Tactics
The survey identified the tactics currently being employed for each megatrend. As an example, for Rise of Boomers, four packaging tactics were explored: enlarged print, improved ergonomics, easy open, and compliance packaging. The table below shows the packaging tactics being employed by respondents that are testing or have commercialized products.
Rise of Boomers packaging tactics
Table 1: Respondent mix by industry
|
Tactics
|
% of Respondents
|
| Enlarged Print |
30%
|
| Improved Ergonomics |
61%
|
| Easy Open |
73%
|
| Compliance Packaging |
55%
|
The level of engagement is varied across these four tactics. For example, Easy Open is being implemented by nearly three-fourths of respondents, while only 30% are engaged with Enlarged Print. This doesn’t mean that companies should jump to using larger print; instead, companies need to evaluate how well these tactics apply to their specific situations and consumers. But, if a tactic has merit, engaging in the tactic before the competition does can be a useful advantage.
The table below shows the tactics used by survey respondents for all consumer megatrends.
Packaging tactics by megatrend
| Tactics | % of Respondents |
| Rise of Boomers | |
| Enlarged Print | 30% |
| Improved Ergonomics | 61% |
| Easy Open | 73% |
| Compliance Packaging | 55% |
| Rise of Singles | |
| Single Serve | 57% |
| Reduced Pack Size | 77% |
| Scrimp | |
| Bulk/Club Packaging | 59% |
| Private Label/Generic Branding | 66% |
| Lowest-cost Packaging | 82% |
| Splurge | |
| High Deco/Shelf Appeal | 69% |
| Unique Custom Shapes and Designs | 70% |
| New Technology/Early Adopter | 66% |
| Secondary/Tertiary Packaging | 60% |
| Comfort | |
| Improved Ergonomics | 67% |
| Tamper Evident | 67% |
| Nostalgic & Retro | 56% |
| Anti-counterfeiting | 53% |
| Tactics | % of Respondents |
| Convenience | |
| Single Serve | 54% |
| Resealability | 71% |
| All-in-one | 72% |
| Ready to Use | 81% |
| Dose Control | 52% |
| Portable | 52% |
| Easy to Open | 76% |
| Richer & Bolder Experiences | |
| Scented Labels and Containers | 21% |
| Labeling Claims | 73% |
| Reactive Labels and Inks | 29% |
| Powered/Electronic-enabled technology | 15% |
| Individualized Connectivity | |
| Made-to-order | 61% |
| Label Messaging | 62% |
| QR Codes | 52% |
| Personal Health & Wellness | |
| Labeling Claims | 74% |
| Portion Control | 45% |
| Safer/Healthier Substrate | 73% |
| Reusable Containers | 60% |
| Community & Sustainability | |
| Made in America | 68% |
| Labels that Support Causes | 39% |
| Improvement in Material Inputs | 66% |
| Reduction of Material Outputs | 83% |
| Reduced Energy Waste | 77% |
| Third Party Certifications | 68% |

This list of packaging tactics is broad but offers many areas for further investigation. Packaging can help build a product’s relevance to consumers. This list can guide discussions on how to harness packaging’s power to appeal to and resonate with consumers.
Summary
Consumer needs are always evolving. Companies that can best identify these consumer needs and mobilize their assets will be able to capitalize. This paper summarizes quantitative research from 1,097 survey respondents. These respondents assessed ten consumer megatrends as to the lifestage of each trend (whether they are on the rise or decline), the adoption rate of each trend (whether companies are reacting to the trend), and the packaging tactics being used. While the study found general agreement in the existence of the ten megatrends, a large proportion of companies are not engaging in or adopting the trends. This suggests there are important opportunities for companies to supercharge how well they respond to consumers and, thus, improve how well they perform financially. Your company’s position may not conform to the survey averages. A useful step is to place each of the ten megatrends into its momentum lifestage for your markets and segments. Then you can assess how well your company is addressing or adopting each trend. Packaging can be a valuable tool in making products that resonate with these trends, so you should have thorough discussions and engage the right partners that can bring expertise to the table. This overall process will help focus your resources and will increase the odds that you can attract, retain, and engage consumers. And because consumer needs are always evolving, keeping the pulse of consumers is an evergreen project that should be built into your regular marketing and planning cycle.